
Signal Categories
Signals roll up into eight categories. Each category groups related dimensions used for baselineing, drift, and peer comparison.Collaboration Topology Shift
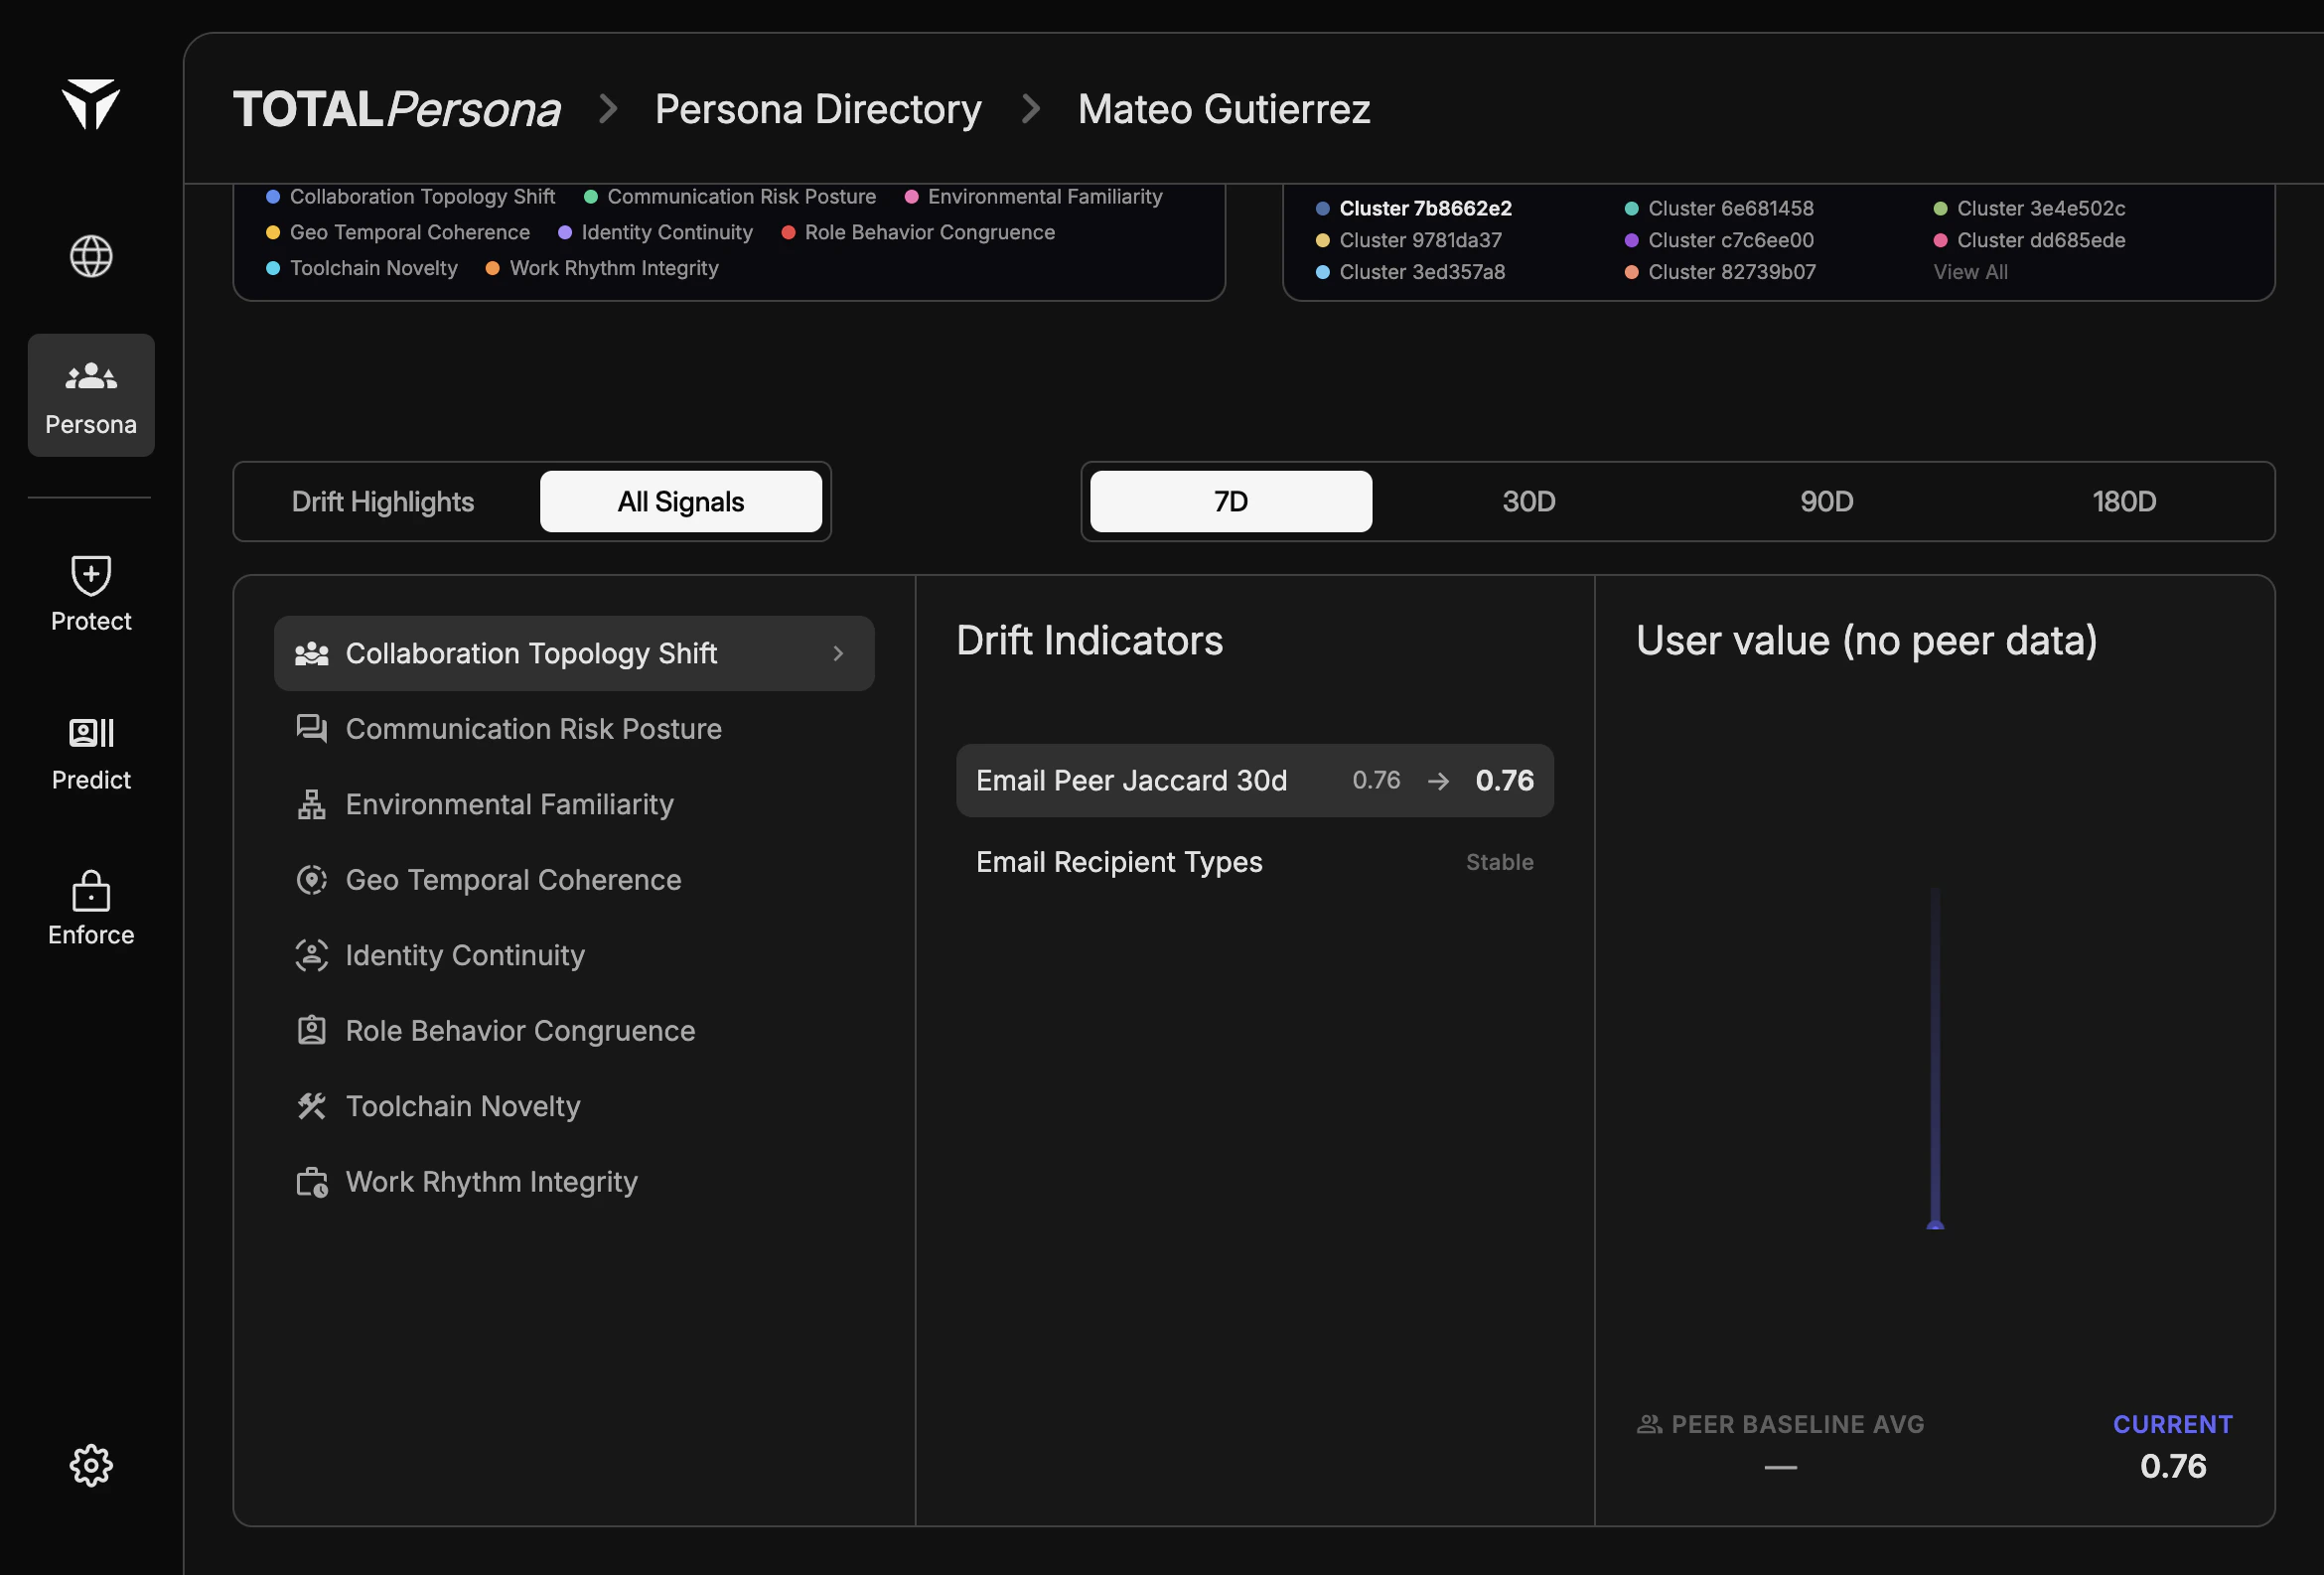
How this identity connects and works with others: collaboration graphs, peer interaction patterns, resource and application access patterns, and indicators of abnormal cross-user coordination.Communication Risk Posture
Email and messaging behavior: patterns, volume, timing, sentiment, and similarity to peers (for example, overlap of correspondent sets over time).Environmental Familiarity
Context of work locations and channels: geo-temporal consistency, VPN or proxy reliance, network destination exposure, and facility-related access attempts outside normal hours.Geo Temporal Coherence
Whether access and activity align with expected locations and schedules, including login cadence anomalies and routine stability.Identity Continuity
Stability of the identity story across sessions and proofs: enrollment and step-up signals, device trust at enrollment, identity proofing confidence, biometric outcomes, and passwordless auth diversity and geo consistency.Role Behavior Congruence
Alignment with stated job function: frontline vs knowledge-work patterns, sensitive responsibilities and data access, and congruence between observed behavior and role.Toolchain Novelty
Changes in tools and agents: novel applications, AI agent usage, and deviation from how similar peers use systems.Work Rhythm Integrity
Stability of day-to-day and hybrid work patterns: after-hours activity, context-switch cadence, and broader routine signals. Individual dimensions include examples such as mouse and keystroke dynamics, device quantity and primary device type, peer enrollment deviation, entitlement expansion velocity, privileged activity level, file accesses, TCAT geo cluster consistency, and others named in your signal catalog.All Signals View
The All Signals layout lists categories on one side and a signal explorer in the center, with a user value chart on the right. Pick a signal to inspect its time series and how it compares to the peer baseline.